Graylog in an LXC
Sadly, it wasn’t until I became a Security Engineer that I truly started to understand the importance of logs. Sure, I’ve had to dig through logs before, but it wasn’t until several months ago that I realized I had no real visibility into what was actually going on in my homelab.
Using tools like Uptime Kuma, I’ve had monitoring set up to alert me when services went offline or became unreachable. But what if a bad actor was trying to brute-force their way into one of my self-hosted services? What if someone was attempting directory or subdomain enumeration? Or what if a bad actor was trying to DoS my web server and it went offline without my knowledge? Any of these things—and much more—could have been happening, and I would have been none the wiser.
Enter SIEM.
SIEM stands for Security Information and Event Management. Every network, big or small, should have a SIEM at the bare minimum. Without one, you’re essentially flying blind with little to no visibility into what’s happening across your hosts. Simply put, a SIEM collects logs (also known as events) from most—if not all—hosts on a network and indexes them in a centralized location in near real time.
These events can be queried using different fields, and those queries can then be used to create alerts. Alerts help identify possible attacks, misconfigurations, or other malicious or suspicious activity. A company’s Security Operations Center (SOC) relies heavily on SIEMs every day to monitor both their own networks and their customers’ environments.
In a homelab environment, monitoring your beloved infrastructure is just as important as having a solid backup strategy. I chose to deploy Graylog in combination with syslog-ng. Graylog acts as the SIEM, and syslog-ng is responsible for collecting logs from hosts and forwarding them to Graylog using the syslog protocol. The two work hand in hand.
Although Graylog can ingest logs using multiple protocols and standards, I primarily use syslog over UDP.
Graylog Setup
Setting up Graylog is very simple. I opted for a single-node install on Ubuntu. Graylog also supports Docker, RHEL, Debian, and SUSE Linux. If you want to cluster your deployment, you can deploy multiple nodes for redundancy and failover.
Graylog consists of three main components:
- MongoDB: Used as the metadata database
- Data Node: Handles log ingestion, processing, and indexing
- Graylog Server: The core service that runs the web interface and APIs
The best part about Graylog is that it runs great in an LXC, which was a requirement for me. I really didn’t want to spin up a full-blown VM and waste extra resources. Graylog—especially when used to its full potential—can be fairly resource-hungry, so an LXC was the perfect balance of efficiency and performance.
When creating the LXC, I went with the following specs:
ubuntu-24.04-standardcontainer template- 4 CPU cores
- 8 GB RAM
- 2 GB swap
- 100 GB root disk
Once the LXC is created, you just follow the official instructions to install Graylog. Here are the installation instructions for Graylog Open on Ubuntu.
Getting Logs Into Graylog
Once you’ve installed Graylog and logged into the web UI, you can start adding inputs—but first, you need something sending logs. Graylog won’t magically pull logs from your systems; they must be forwarded to it. This is where syslog-ng comes into play.
One of the things I wanted to monitor most in my homelab was my Nginx reverse proxy. Nginx access logs provide a ton of insight into who is trying to access your services over HTTPS—and how.
The first hurdle I ran into with Nginx was the logging format. By default, Nginx logs are plain text, which isn’t ideal for parsing in Graylog. The cleaner your logs are before they reach the SIEM, the easier your life will be later.
Thankfully, Nginx allows you to customize the log format. JSON is a widely used standard for structured data, and both Nginx and Graylog support it, so that’s what I went with.
In your nginx.conf file, add the following inside the http block (usually found in /etc/nginx/nginx.conf):
# Logging Settings
log_format json_format escape=json '{'
    '"timestamp":"$time_local", '
    '"remote_addr":"$remote_addr", '
    '"remote_user":"$remote_user", '
    '"request_method":"$request_method", '
    '"server_protocol":"$server_protocol", '
    '"request_uri":"$request_uri", '
    '"status":"$status", '
    '"total_body_bytes_sent":$body_bytes_sent, '
    '"http_referer":"$http_referer", '
    '"http_user_agent":"$http_user_agent", '
    '"request_time_seconds":$request_time, '
    '"host":"$host"'
'}';

access_log /var/log/nginx/access.log json_format;
error_log /var/log/nginx/error.log;
Reload Nginx for the changes to take effect:
sudo nginx -s reloadNow, if you run:
tail -f /var/log/nginx/access.log
You should see logs being written in JSON format.
At this point, we’ve successfully formatted the Nginx logs into something Graylog can easily parse later. On to the next step.
Installing and Configuring syslog-ng
Syslog-ng is just as important as the SIEM itself. Installing it is straightforward. On Ubuntu:
sudo apt-get install syslog-ng -y
Once installed, make sure the service is running:
sudo systemctl status syslog-ng
If everything looks good, navigate to the configuration directory:
cd /etc/syslog-ng
You should see a file named syslog-ng.conf. Before editing it, make a backup:
sudo cp syslog-ng.conf syslog-ng.conf.backupNow edit the file:
sudo nano syslog-ng.conf
Delete everything except the @version and @include lines at the top.
Below is a basic configuration to read Nginx access logs and forward them to Graylog.
Optional settings:
options {
    time-reap(30);
    mark-freq(10);
    keep-hostname(yes);
    chain-hostnames(no);
};
Define the log source:
source s_nginx_access {
    file("/var/log/nginx/access.log" follow_freq(1) flags(no-parse));
};
Define the destination:
destination d_syslog_udp {
    syslog("graylog.example.net" transport("udp") port(1512));
};
Tie it together:
log {
    source(s_nginx_access);
    destination(d_syslog_udp);
};
In short, this tells syslog-ng to check the Nginx access log every second and forward new log entries to Graylog over UDP on port 1512.
Restart syslog-ng:
sudo systemctl restart syslog-ngIf it restarts cleanly, your configuration has no syntax errors.
Creating the Input in Graylog
Now that your Nginx host is sending logs, Graylog needs to receive them.
- Log into Graylog
- Go to System → Inputs
- Select Syslog UDP from the dropdown
- Click Launch new input
- Give it a name (e.g.,
NGINX) - Set the port to match your syslog-ng config
- Set the correct time zone
- Click Launch input
Once it’s running, click Show received messages. You should see logs flowing in from your Nginx server.
Congrats—you’re officially ingesting logs into Graylog.
Unfortunately, your work is far from over. To get meaningful alerts and build dashboards with pretty graphs and bright colors, you’ll need to parse and normalize those logs first. I’ll cover that in a future post.
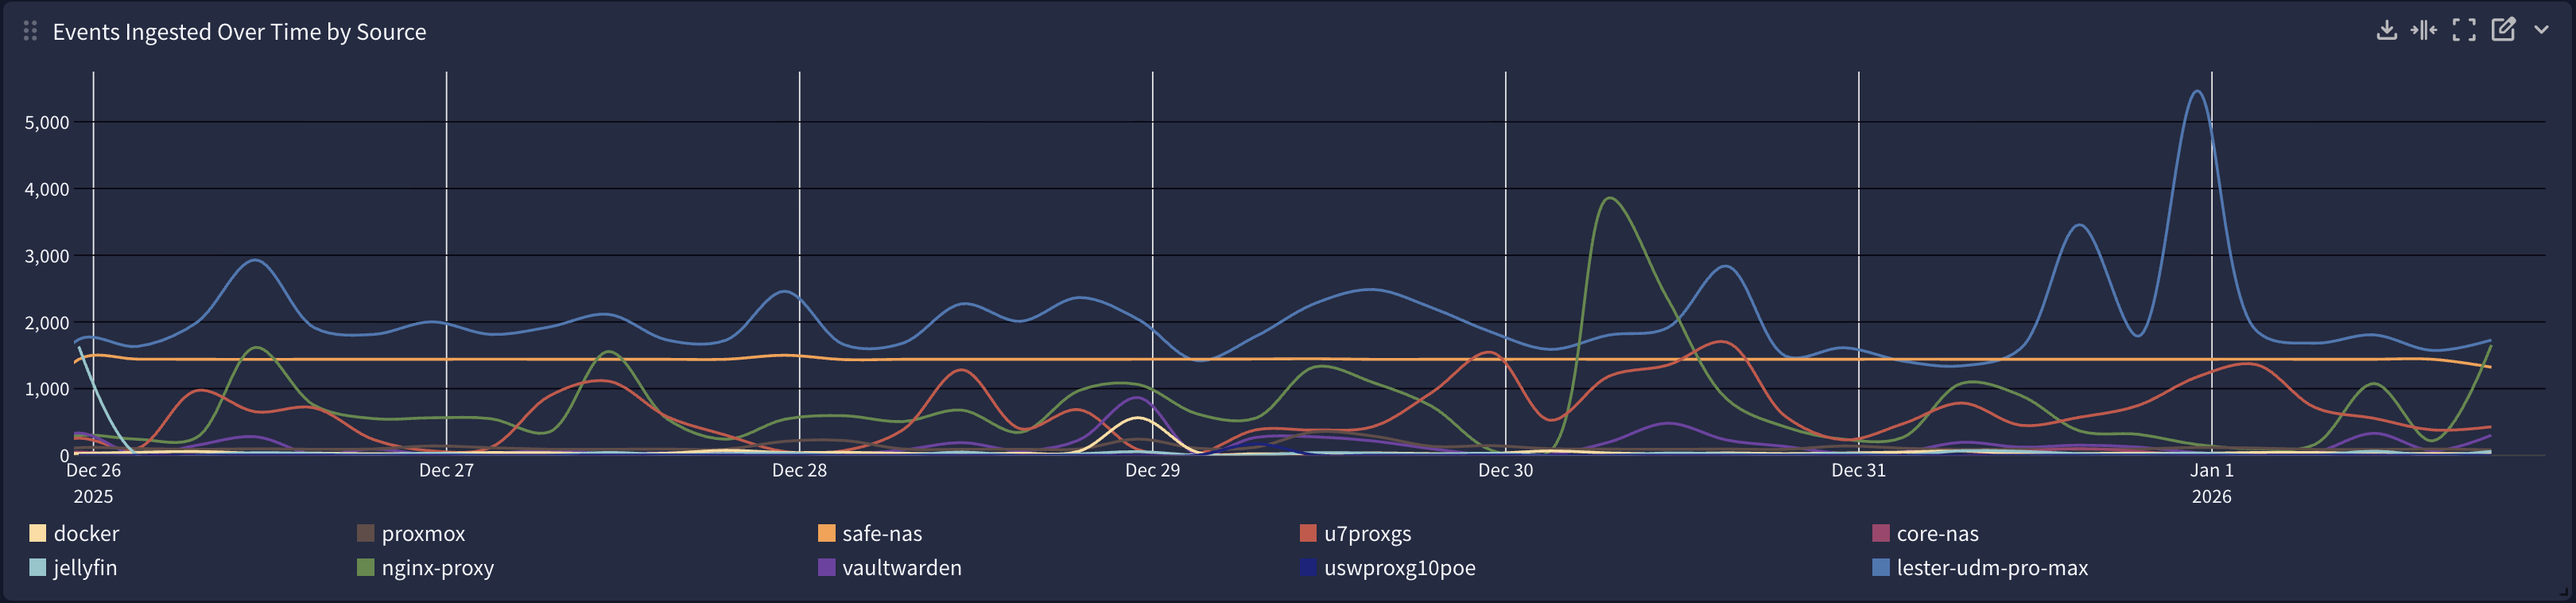
For now, you can repeat this same process for your other hosts. One tip: group similar hosts by input. All my Synology NAS devices share one input. All my UniFi devices share another. All my LXCs share one as well. Keeping similar log formats together prevents input sprawl and makes management much easier.
It’s definitely a learning process, but once you’re ingesting thousands of logs per day, the visibility you gain is incredible. Good luck—and make sure you do it with coffee.